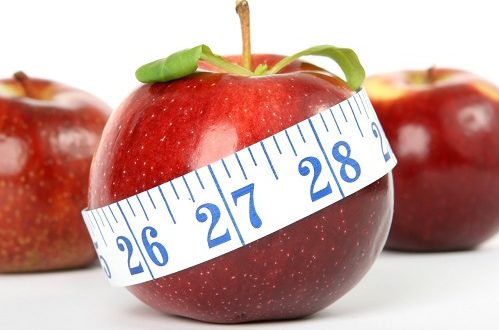
Obesity is a growing problem in the UK. According to recent government figures, 26% are obese of which nearly 3% are morbidly obese. 35% are overweight, together over 60% are weighing more than they should. This is leading to increased hospital admissions and a rise in Diabetes Type 2. only about 2% are underweight.
Sugar Tax
The recently introduced Sugar Tax, is a first step in fighting the problem. The tax applies to soft drinks only; for those with 5-8g sugar added per 100ml, the tax is 18p per litre, those with over 8g of sugar added, it is 24p per litre. Not surprisingly, manufacturers have reacted with some drinks have been reformulated to get them below the thresholds.
Calories Counting – How Alcoholic Drinks Compare
We all know that alcohol is fattening, but how does it compare with soft drinks. In the table below, we have looked at typical figures for drink categories, there are small variance between brands and sub-types.
The calories per 100ml column, is included so you can compare, for example drinking beer or cola. We’re not advocating you drink 100ml of Gin! Incidentally, whilst a single Gin doesn’t look to fattening, when you add in a regular tonic, its comparable with wine. Data from Drinkaware.
| Description | Volume | Strength | Units | Calories | Calories per 100ml |
| Wine | 125ml | 14% | 1.8 | 125 | 100 |
| Wine | 250ml | 14% | 3.5 | 250 | 100 |
| Beer | Pint (568ml) | 4% | 2.3 | 182 | 32 |
| Beer | Pint (568ml) | 5% | 2.8 | 227 | 43 |
| Beer | Pint (568ml) | 6% | 3.4 | 346 | 67 |
| Cider | Pint (568ml) | 4.5% | 2.6 | 216 | 38 |
| Spirit | Single measure (25ml) | 40% | 1 | 61 | 240 |
| Spirit | Double measure (50ml) | 40% | 2 | 122 | 240 |
| Cola | 330ml | – | – | 140 | 42 |
| Cola diet | 330ml | – | – | 1 | 0 |
| Smoothie | 250ml | – | – | 170 | 68 |
| Tonic | 250ml | – | – | 92 | 37 |
| Fresh Orange | 200ml | – | – | 94 | 38 |
| Tap Water | – | – | – | 0 | 0 |
 Vino-Club For Wine Lovers


